Online or onsite, instructor-led live Data Visualization training courses demonstrate through discussion and hands-on practice the skills, strategies, tools and approaches for visualizing and reporting data for different audiences. Case studies are also analyzed and discussed to exemplify how data visualization solutions are being applied in the real world to derive meaning out of data and answer crucial questions..
Data Visualization training is available as "online live training" or "onsite live training". Online live training (aka "remote live training") is carried out by way of an interactive, remote desktop. Onsite live Data Visualization training can be carried out locally on customer premises in Braga or in NobleProg corporate training centers in Braga.
NobleProg -- Your Local Training Provider
Hotel Melia Braga
nº8, Avenida General Carrilho da Silva Pinto, nº 8, 4715-380 Braga, Braga, Portugal, 4715-380 Braga
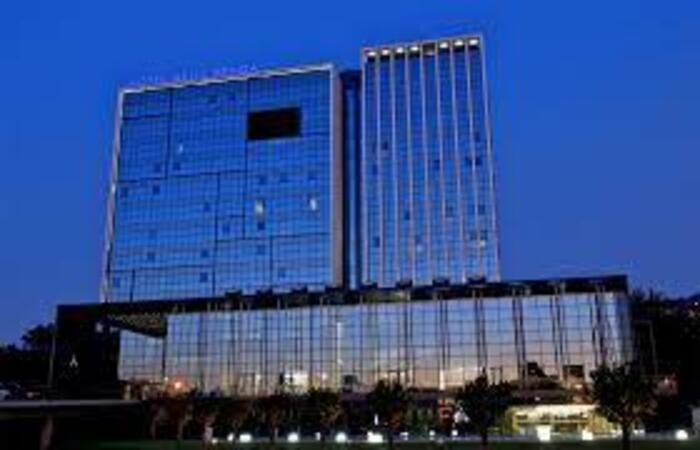
This instructor-led, live training in Braga (online or onsite) is aimed at intermediate-level Grafana users who wish to build interactive, drill-down dashboards with dynamic thresholds and contextual updates.By the end of this training, participants will be able to:
Create dashboards that respond to user interactions, such as clicking a graph bar
Implement visual drill-downs that update in-place (without new tabs)
Configure pie charts and detailed panels based on selection filters
Use dynamic thresholds that react to user input and real-time data
This instructor-led, live training in Braga (online or onsite) is aimed at intermediate-level developers and DevOps engineers who wish to instrument their applications to export and monitor custom metrics effectively using Prometheus and Grafana.
By the end of this training, participants will be able to:
Understand the importance of custom metrics for application monitoring.
Instrument applications to export custom metrics for Prometheus.
Create and configure dashboards in Grafana to visualize custom metrics.
Apply best practices for integrating monitoring into the development lifecycle.
This instructor-led, live training in Braga (online or onsite) is aimed at beginner-level data scientists who wish to learn how to create meaningful and visually appealing data visualizations.
By the end of this training, participants will be able to:
Set up and navigate Google Colab for data visualization.
Create various types of plots using Matplotlib.
Utilize Seaborn for advanced visualization techniques.
Customize plots for better presentation and clarity.
Interpret and present data effectively using visual tools.
This instructor-led, live training in Braga (online or onsite) is aimed at advanced-level DevOps and SRE professionals who wish to enhance their alerting and automation skills with Grafana and Prometheus.
By the end of this training, participants will be able to:
Create and manage advanced alerting rules in Prometheus.
Integrate Prometheus Alertmanager with external tools using webhooks.
Automate responses to alerts for faster issue resolution.
Use Grafana to visualize and manage alerts effectively.
This instructor-led, live training in Braga (online or onsite) is aimed at intermediate-level cloud and DevOps engineers who wish to enhance cloud observability with Grafana and Prometheus.
By the end of this training, participants will be able to:
Understand the benefits of integrating Grafana and Prometheus with cloud platforms.
Set up Prometheus for monitoring cloud-based resources.
Configure Grafana for visualizing cloud service metrics.
Leverage cloud-native tools and integrations for monitoring scalability.
This instructor-led, live training in Braga (online or onsite) is aimed at beginner to intermediate-level IT professionals who wish to gain the knowledge and practical skills necessary to excel in the administration of Grafana and GLPI.
By the end of this training, participants will be able to:
Create and customize Grafana dashboards with different visualizations.
Implement alerting and notifications for monitoring.
Administer user accounts, teams, and permissions.
Manage IT assets effectively, including hardware and software inventory.
Implement a helpdesk system for user support and ticket management.
Participants who complete this training will gain a practical, real-world understanding of Data Science and its related technologies, methodologies and tools.
Participants will have the opportunity to put this knowledge into practice through hands-on exercises. Group interaction and instructor feedback make up an important component of the class.
The course starts with an introduction to elemental concepts of Data Science, then progresses into the tools and methodologies used in Data Science.
Audience
Developers
Technical analysts
IT consultants
Format of the Course
Part lecture, part discussion, exercises and heavy hands-on practice
Note
To request a customized training for this course, please contact us to arrange.
This instructor-led, live training in Braga (online or onsite) is aimed at data analysts who wish to build analytic applications using Python with Plotly and Dash.
By the end of this training, participants will be able to:
Set up a real-time interactive dashboard for streaming live updating data.
Build interactive dashboards using Python for data science solutions.
Secure interactive dashboards with advanced authentication methods.
In this instructor-led, live training in Braga, participants will learn how to create web-based data-driven visualizations that run on multiple devices responsively.
By the end of this training, participants will be able to:
Use D3 to create interactive graphics, information dashboards, infographics and maps.
Control HTML with jQuery-like selections.
Transform the DOM by selecting elements and joining to data.
This course is intended for engineers and decision makers working in data mining and knoweldge discovery.
You will learn how to create effective plots and ways to present and represent your data in a way that will appeal to the decision makers and help them to understand hidden information.
In this instructor-led, live training in Braga, participants will learn the skills, strategies, tools and approaches for visualizing and reporting data for different audiences. Case studies are also analyzed and discussed to exemplify how data visualization solutions are being applied in the real world to derive meaning out of data and answer crucial questions.
By the end of this training, participants will be able to:
Write reports with captivating titles, subtitles, and annotations using the most suitable highlighting, alignment, and color schemes for readability and user friendliness.
Design charts that fit the audience's information needs and interests.
Choose the best chart types for a given dataset (beyond pie charts and bar charts.)
Identify and analyze the most valuable and relevant data quickly and efficiently.
Select the best file formats to include in reports (graphs, infographics, references, GIFs, etc.)
Create effective layouts for displaying time series data, part-to-whole relationships, geographic patterns, and nested data.
Use effective color-coding to display qualitative and text-based data such as sentiment analysis, timelines, calendars, and diagrams.
Apply the most suitable tools for the job (Excel, R, Tableau, mapping programs, etc.)
This course teaches you about human perception and how to leverage it to deliver the best insights. You will get familiar with design theory, including Gestalt Laws, pre-attentive attributes, and inclusivity. You will also understand the similarities and differences between exploratory and explanatory analysis. You will discover the usage of the charts and learn how to choose the most suitable one. At the end of the course, you will know how to implement the design principles is visualizations created using Tableau software.
Apache Druid is an open-source, column-oriented, distributed data store written in Java. It was designed to quickly ingest massive quantities of event data and execute low-latency OLAP queries on that data. Druid is commonly used in business intelligence applications to analyze high volumes of real-time and historical data. It is also well suited for powering fast, interactive, analytic dashboards for end-users. Druid is used by companies such as Alibaba, Airbnb, Cisco, eBay, Netflix, Paypal, and Yahoo.
In this instructor-led, live course we explore some of the limitations of data warehouse solutions and discuss how Druid can compliment those technologies to form a flexible and scalable streaming analytics stack. We walk through many examples, offering participants the chance to implement and test Druid-based solutions in a lab environment.
Format of the Course
Part lecture, part discussion, heavy hands-on practice, occasional tests to gauge understanding
This instructor-led, live training in Braga (online or onsite) is aimed at beginner-level professionals who wish to gain a mastery of the fundamentals of R and how to work with data.By the end of this training, participants will be able to:
Understand the R programming environment and RStudio interface.
Import, manipulate, and explore datasets using R commands and packages.
Perform basic statistical analysis and data summarization.
Generate visualizations using both base R and ggplot2.
Manage workspaces, scripts, and packages effectively.
Course is dedicated for those who would like to know an alternative program to the commercial MATLAB package. The three-day training provides comprehensive information on moving around the environment and performing the OCTAVE package for data analysis and engineering calculations. The training recipients are beginners but also those who know the program and would like to systematize their knowledge and improve their skills. Knowledge of other programming languages is not required, but it will greatly facilitate the learners' acquisition of knowledge. The course will show you how to use the program in many practical examples.
Learn how to Get & Transform Data to Prepare Interactive Dashboards
Power BI is one of the most popular Data Visualization tool, and a Business Intelligence Tool. Power BI is a collection of data connectors, apps, and software services, which are used to get data from different source, transforms data, and produce beautiful reports.
Power BI also allows you to publish them for your organization so that you can access them using mobiles, tablets etc. In this Power BI Tutorial, we will show you the step by step approach to connect with multiple data sources, data transformations, and creating reports like charts, tables, matrix, maps, etc
About the Course:
Microsoft Power BI transforms your company data into rich visuals that facilitate new ways of thinking about and organizing your data, so that you can focus on what is important to achieving your goals. This course covers both Power BI on Line and Power BI desktop.
Audience:
This course is intended for Business Managers, Report Developers, Analysts, Project Managers and Team Leads.
At Course Completion
Upon completing this course, students will have a basic understanding of the topics below, as well as an ability to utilize and implement the concepts learned.
Power BI
Power BI Desktop
Working with CSV, TXT, and Excel Worksheets
Connecting to Databases
Merging, Grouping, Summarizing, and Calculating Data
Microsoft Power BI is a free Software as a Service (SaaS) suite for analyzing data and sharing insights. Power BI dashboards provide a 360-degree view of the most important metrics in one place, updated in real time, and available on all of their devices.
This instructor-led, live training (online or onsite) is aimed at business managers, business analysts, data analysts, report developers, and team leads who wish to design a perfect Power BI dashboard.
By the end of this training, participants will be able to:
Design beautiful and efficient dashboards following the critical rules.
Choose the right charts based on the kind of data for display.
Format of the Course
Interactive lecture and discussion.
Lots of exercises and practice.
Hands-on implementation in a live-lab environment.
Course Customization Options
To request a customized training for this course, please contact us to arrange.
In this instructor-led, live training in Braga (onsite or remote), participants will learn how to use Microsoft Power BI to analyze and visualize data using a series of sample data sets.
By the end of this training, participants will be able to:
Create visually compelling dashboards that provide valuable insights into data.
Obtain and integrate data from multiple data sources.
This instructor-led, live training in Braga (online or onsite) is aimed at data analysts and data scientists who wish to use Python to build interactive data visualizations directly from the code.
By the end of this training, participants will be able to:
Set up the necessary development environment to start creating data visualizations with Python.
Understand the data visualization core concepts, use cases, and tools.
Explore the different libraries (Matplotlib, Seaborn, Bokeh, and Folium) available in Python.
Learn how to create line plots, statistical graphs, geo-spatial, and other complex data visualizations with Python.
Know the best practices and techniques for presenting and interpreting data.
This instructor-led, live training in Braga (online or onsite) is aimed at data analysts and web developers who wish to develop associative models in Qlik Sense.
By the end of this training, participants will be able to:
Apply Qlik Sense in data science.
Use and navigate the Qlik Sense interface.
Build a data literate workforce with AI interaction.
In this instructor-led, live training in Braga (online or onsite), participants will learn how to use QlikView to support decision making in their organization.
By the end of this training, participants will be able to:
Install and configure QlikView.
Analyze and display data using QliKView.
Use data discoveries from QlikView to support decision making.
In this instructor-led, live training in Braga (online or onsite), participants will learn how to start developing with QlikView.
By the end of this training, participants will be able to:
Install and configure QlikView.
Transform data from various sources through QlikView scripting.
Tableau is a business intelligence and data visualization tool. Python is a widely used programming language which provides support for a wide variety of statistical and machine learning techniques. Tableau's data visualization power and Python's machine learning capabilities, when combined, help developers rapidly build advanced data analytics applications for various business use cases.
In this instructor-led, live training, participants will learn how to combine Tableau and Python to carry out advanced analytics. Integration of Tableau and Python will be done via the TabPy API.
By the end of this training, participants will be able to:
Integrate Tableau and Python using TabPy API
Use the integration of Tableau and Python to analyze complex business scenarios with few lines of Python code
Audience
Developers
Data scientists
Format of the course
Part lecture, part discussion, exercises and heavy hands-on practice
This course is designed for the learner who has never used Tableau before, or who may need a refresher. It will guide you through the steps necessary to create your first visualization from the beginning. You will also learn how to apply essential design principles to your Tableau visualizations. By the end of the course, you will be able to create and share your insights with the broader audience.
This instructor-led, live training in Braga (online or onsite) is aimed at developers who wish to use BusinessEvents and ActiveMatrix Service Bus to develop, deploy, and manage event driven applications.
By the end of this training, participants will be able to:
Set up the necessary development environment to start developing.
The Tidyverse is a collection of versatile R packages for cleaning, processing, modeling, and visualizing data. Some of the packages included are: ggplot2, dplyr, tidyr, readr, purrr, and tibble.
In this instructor-led, live training, participants will learn how to manipulate and visualize data using the tools included in the Tidyverse.
By the end of this training, participants will be able to:
Perform data analysis and create appealing visualizations
Draw useful conclusions from various datasets of sample data
Filter, sort and summarize data to answer exploratory questions
Turn processed data into informative line plots, bar plots, histograms
Import and filter data from diverse data sources, including Excel, CSV, and SPSS files
Audience
Beginners to the R language
Beginners to data analysis and data visualization
Format of the course
Part lecture, part discussion, exercises and heavy hands-on practice
This is a compelling 4-day course for Tableau beginners. During this course, you will get familiar with all Tableau features and learn how to create and share data visualization with others. The course will guide you through all of the steps, including connecting to data, creating calculations, choosing a chart, building the dashboard, and publishing your work.
The course is divided into lectures dedicated to each topic, followed by practical exercises. The course will end with 30 minutes test and 60 minutes project assignment.
Course milestones:
Get familiar with Tableau interface.
Connect to and work with your data.
Use the Tableau features.
Build an insightful visualization.
Share your work with a broader audience.
Format of the Course:
Interactive lecture and discussion.
Lots of exercises and practice.
Hands-on implementation in a live-lab environment.
Knowledge test and hands-on project at the end of the course
This instructor-led, live training introduces the concepts behind interactive data analytics and walks participants through the deployment and usage of Zeppelin in a single-user or multi-user environment.
By the end of this training, participants will be able to:
Install and configure Zeppelin
Develop, organize, execute and share data in a browser-based interface
Visualize results without referring to the command line or cluster details
Execute and collaborate on long workflows
Work with any of a number of plug-in language/data-processing-backends, such as Scala (with Apache Spark), Python (with Apache Spark), Spark SQL, JDBC, Markdown and Shell.
Integrate Zeppelin with Spark, Flink and Map Reduce
Secure multi-user instances of Zeppelin with Apache Shiro
Read more...
Last Updated:
Testimonials (16)
The energy, knowledge and style of teaching of the trainer
Ioana - MOLSONCOORS GLOBAL BUSINESS SERVICES SRL
Course - From Tableau Beginners to Advanced User
Weronika created a really friendly, informal atmosphere. The training involved a lot of useful knowledge transfer, technical skills exercises and theory, as well as best practices and guidance on how to handle our own data.
Julia Kuczma - DLA Piper GSC Poland Sp. z o.o.
Course - Tableau Intermediate Training Course
I liked Pablo's style, the fact that he covered a lot of subjects from report design , customization with html to implementing simple ML algortithms. Good balance theoretical information / exercices. Pablo really covered all topics i was interested in and gave comprehensive answers to my questions.
Cristian Tudose - SC Automobile Dacia SA
Course - Advanced Data Analysis with TIBCO Spotfire
Younes is a great trainer. Always willing to assist, and very patient. I will give him 5 stars. Also, the QLIK sense training was excellent, due to an excellent trainer.
Dietmar Glanninger - BMW
Course - Qlik Sense for Data Science
Instructor is an expert in her subject matter. Teaching over zoom can be difficult since it's hard to gauge your audience but the instructor did great.
Nicolo Menez - AllianceBernstein
Course - Python with Plotly and Dash
Real-world example
Hans Alain Nyaba - Federal Geospatial Platform, Natural Resources Canada
Course - D3.js for Data Visualization
Actual application of spotfire and all basic functions.
Michael Capili - STMicroelectronics, Inc.
Course - Introduction to Spotfire
The second day was very interesting.
It was a good training to see some possibilities within Power BI; but mostly you learn then while you work with Power BI. Fact is also that the training base has all access rights and everything works, but as soon as you try to connect to the live system, it does not work and this makes the knowledge transfer a bit difficult.
Marco Iuliano
Course - Power BI Dashboards
Real world knowledge from someone in the industry
Matthew Cerbas - Shield Consulting Solutions, Inc.
Course - Grafana
Training adjust the training according to our needs and knowledge. He understood participants experience with Power BI.
Cristian Tudor - Gilbarco ACIS SRL
Course - Creating Dashboards Using Microsoft Power BI
I genuinely enjoyed the hands passed exercises.
Yunfa Zhu - Environmental and Climate Change Canada
Course - Foundation R
The pace was just right and the relaxed atmosphere made candidates feel at ease to ask questions.
Rhian Hughes - Public Health Wales NHS Trust
Course - Introduction to Data Visualization with Tidyverse and R
I enjoyed the exercices gives a good insight.
Andreas Kukacka
Course - ELK: Elasticsearch, Logstash and Kibana for Administrators
I genuinely enjoyed the lots of labs and practices.
Vivian Feng - Destination Canada
Course - Data Analysis with SQL, Python and Spotfire
I really enjoyed the training exercise.
Edward Dan Dree Manalad - Marine Benefits, Inc.
Course - Power BI for Business Analysts
I thought that the information was interesting.
Allison May
Course - Data Visualization
Provisional Upcoming Courses (Contact Us For More Information)
Online Data Visualization training in Braga, Data Visualization training courses in Braga, Weekend Data Visualization courses in Braga, Evening Data Visualization training in Braga, Data Visualization instructor-led in Braga, Data Visualization classes in Braga, Data Visualization trainer in Braga, Data Visualization instructor in Braga, Evening Data Visualization courses in Braga, Weekend Data Visualization training in Braga, Data Visualization private courses in Braga, Data Visualization coaching in Braga, Data Visualization instructor-led in Braga, Data Visualization on-site in Braga, Data Visualization one on one training in Braga, Online Data Visualization training in Braga, Data Visualization boot camp in Braga